
The Current Situation
I’ve recently moved to a new apartment.
For the most part, networking here is nice. There is a fiber connection, and my chose isp supports IPv6, and can allocate a static IPv4 address (meaning no cgNAT).
There is one hicup however. While I have a subscription for a 1000Mbit/s up/down, in practice, I’m consistently getting something around 400Mbit/s. I was warned that this could happen, and that often, you’ll end up having to write to your ISP and they will fix it.
But even then, they may later downgrade your connection again, and this back and forth may potentially continue indefinetly.
I think the ISPs bet on the consumers growing tired of monitoring their internet speeds, and hope to win through attrition, until the customer simply accepts it’s too big of a hassle to constantly monitor their ISPs shenanigans.
Such a battle I would personally lose quickly, I’m extremely lazy. But I still want my internet fast >:(
So, one solution that doesn’t require me constantly monitoring would be to simply automate the whole process. If I could simply collect internet speed metrics and either alert myself when it drops below their SLO of 900Mbit/s down 900Mbit/s up, or… just send the alert formatted as a mail directly to their customer service, I woudln’t have to worry about this…
Prometheus Push Gateway
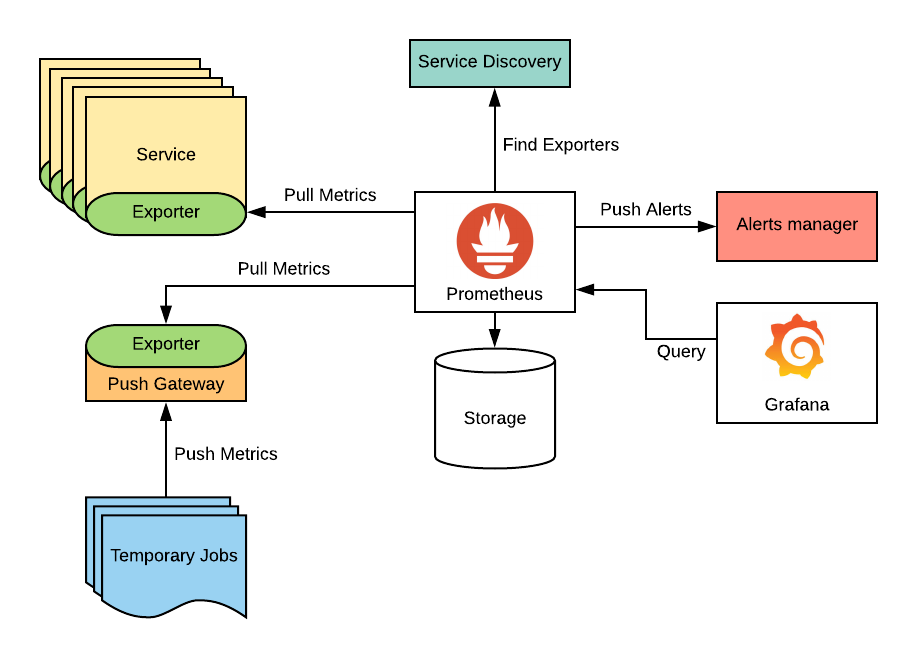
Prometheus is an observability service that scrapes metrics, collects them,
and allows manipulation of metrics with its query language promql.
It also allow for alerting when certain conditions are met, such as the metric for a processors temperature exceeding 80 degrees celsius for 5 minutes, for instance.
However, prometheus is a pull based system, for several, very good reasons. This works specially well when you are monitoring some long running service exposing a metrics endpoint, but we just wanna run a oneshot program ocassionally, and send the results to prometheus.
Since prometheus doesn’t pull continuously, but with a fixed interval, if the oneshot service isn’t alive long enough to expose the metrics, we may miss some values.
This is where the push gateway comes in. It acts as a middle layer between a batch job and prometheus, acting as the long lived service that keeps all the metrics we send to it, meaning the batch job just has to send the information to the push gateway, and then it can die until it’s triggered again.
Configuring the push gateway is fairly easy if you already have a NixOS prometheus deployment.
| |
This is a snippet of my larger prometheus config.
| |
Taking a closer look at the pushgateway part of the configuration, we
essentially just have to enable it, and give it an address to listen on. We
also enable persisting metrics with persistMetrics = true, but remember to put
some methods in place for ensuring this doesn’t grow indefinetly.
| |
This part sets up the scrape targets prometheus will pull from. Here, instead of
hardcoding the target address of the pushgateway, we simply take it’s value from
the configuration we set before, making the address easier to refactor in the
future, if we for instance wanna expose it over the internet (requiring us to
change the address to 0.0.0.0:9091).
Periodically Testing the Bandwidth
Now, we wanna test the speed. We can send arbitrary metrics to the push gateway like this:
| |
Here, we send the metric some_metric with the value 1337 and a job name
example_job. We could also specify an instance like this:
| |
Now the metric will also have a {instance="some_instance"} label.
We can then expand this script to send network bandwidth.
| |
This pushes a network_speed_bytes_per_second metric with a value from the
Ookla speedtest cli tool. We do some json parsing
to get just the bandwidth, and use sed to remove some extra data.
If we wanted to be extra, we could use all the rich information speedtest-cli
exposes, but I’m too lazy to write something turning the output of
speedtest-cli --json into prometheus labels.
We can then wrap this script into a systemd service.
| |
This defines a speedtest.service service for systemd, with the script we just made.
Notice how we specify the binaries with ${pkgs.<package>}/bin/<package>. This
is because systemd will not have the same packages in it’s path as a normal user
of the machine, so we need to give it absolute paths.
We also define the type of the service to be oneshot, and set DynamicUser = true, which allocated a UNIX user ID for a service process when it starts, and
releases it when it’s
done.
With all this is place, we just need to run our service regularly. Let’s start with something obnoxious, such as every minute.
| |
This creates a systemd speedtest.timer timer, that will run every minute (as
specified by OnCalendar = "*-*-* *:*:00";[1]). We also point this to the
correct unit, the one we defined earlier, speedtest.service.
Now this will run every minute, testing the bandwidth, and send the results to the pushgateway, that will then get scraped by prometheus periodically.
Results
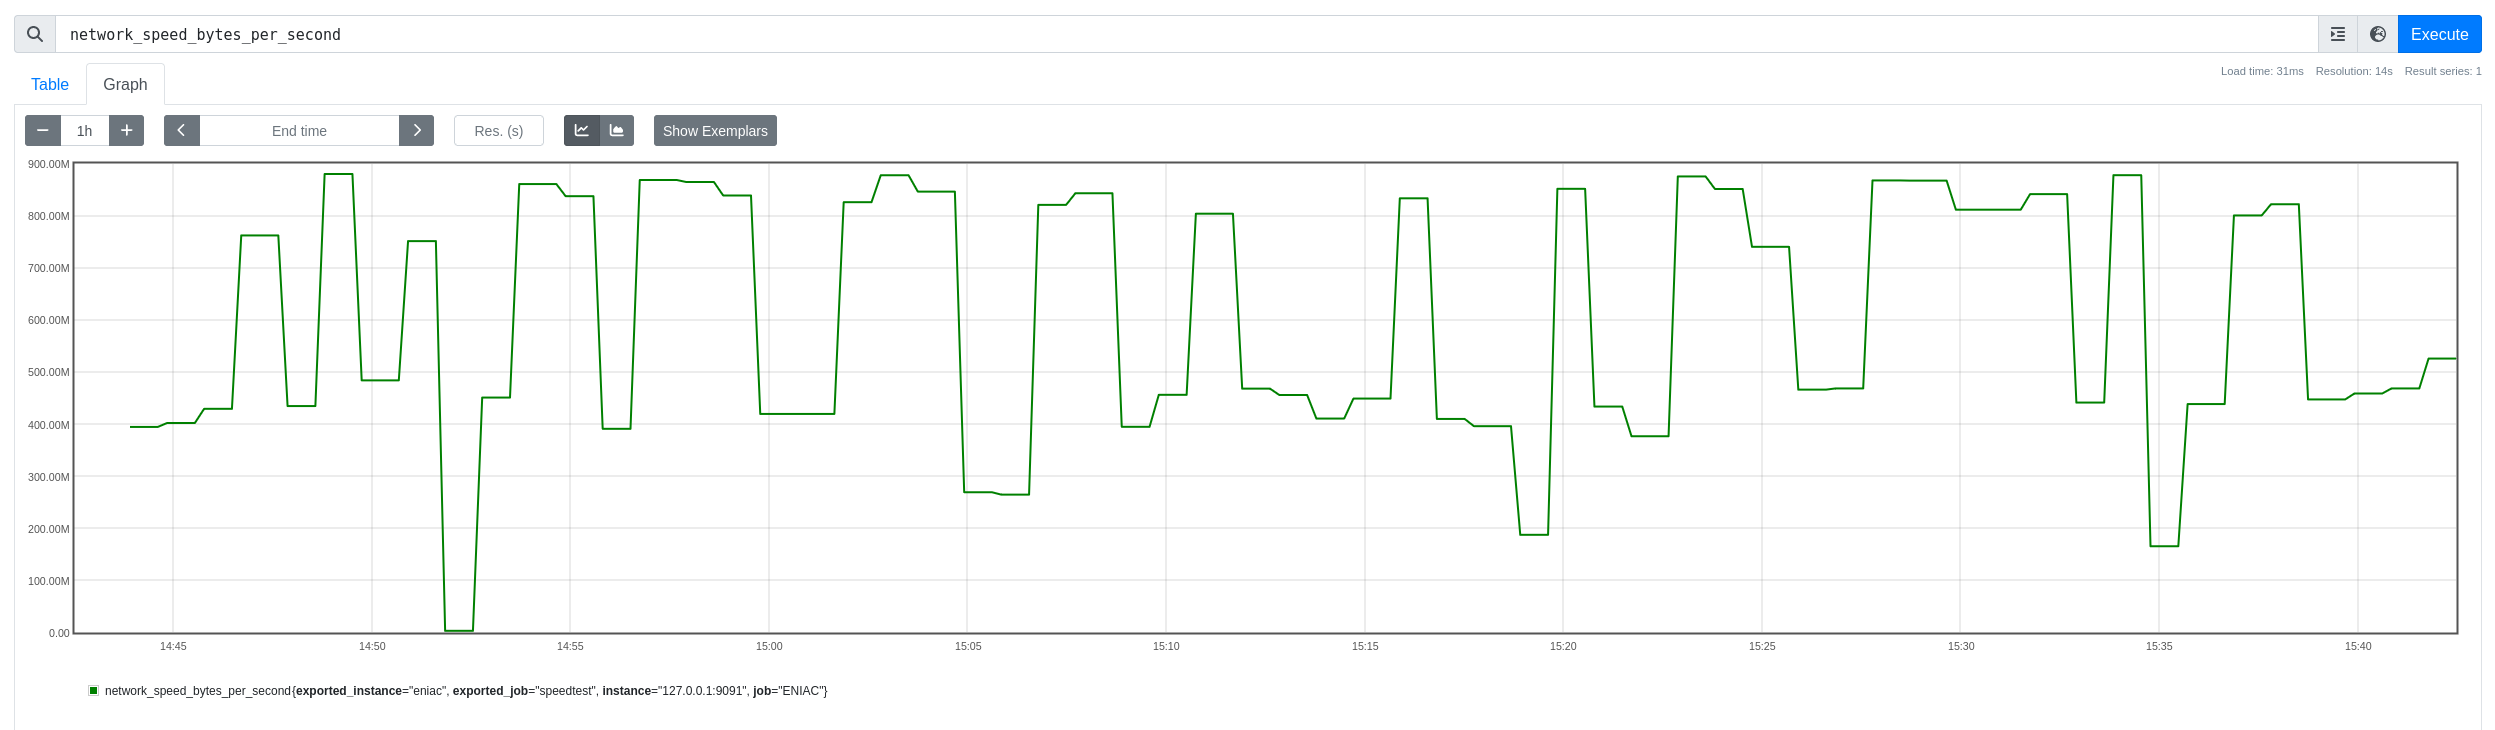
The picture above demonstrates how this metrics looks in the graph view of the prometheus web interface.
From here, we can consider setting up alerting if it falls below a threshold for a certain period, and making that alert trigger some email being sent to our ISP.
I’ll hopefully not have to write that blogpost because my ISP fixes my internet dropping soon, but if they don’t, expect that in the near future :3
Footnotes
[1]: For details on the format, see this, specifically the section about calendar events.